Datalogging
Record live values from the ECU, plot them on a shared timeline and analyse pulls, boost and changes between runs.
The plotting and analysis tools are run against datalog files and found to work. They have not yet been tested in real life (log, make a change, log again) to see how well they perform.
Start logging
- Connect your adapter and choose the vehicle.
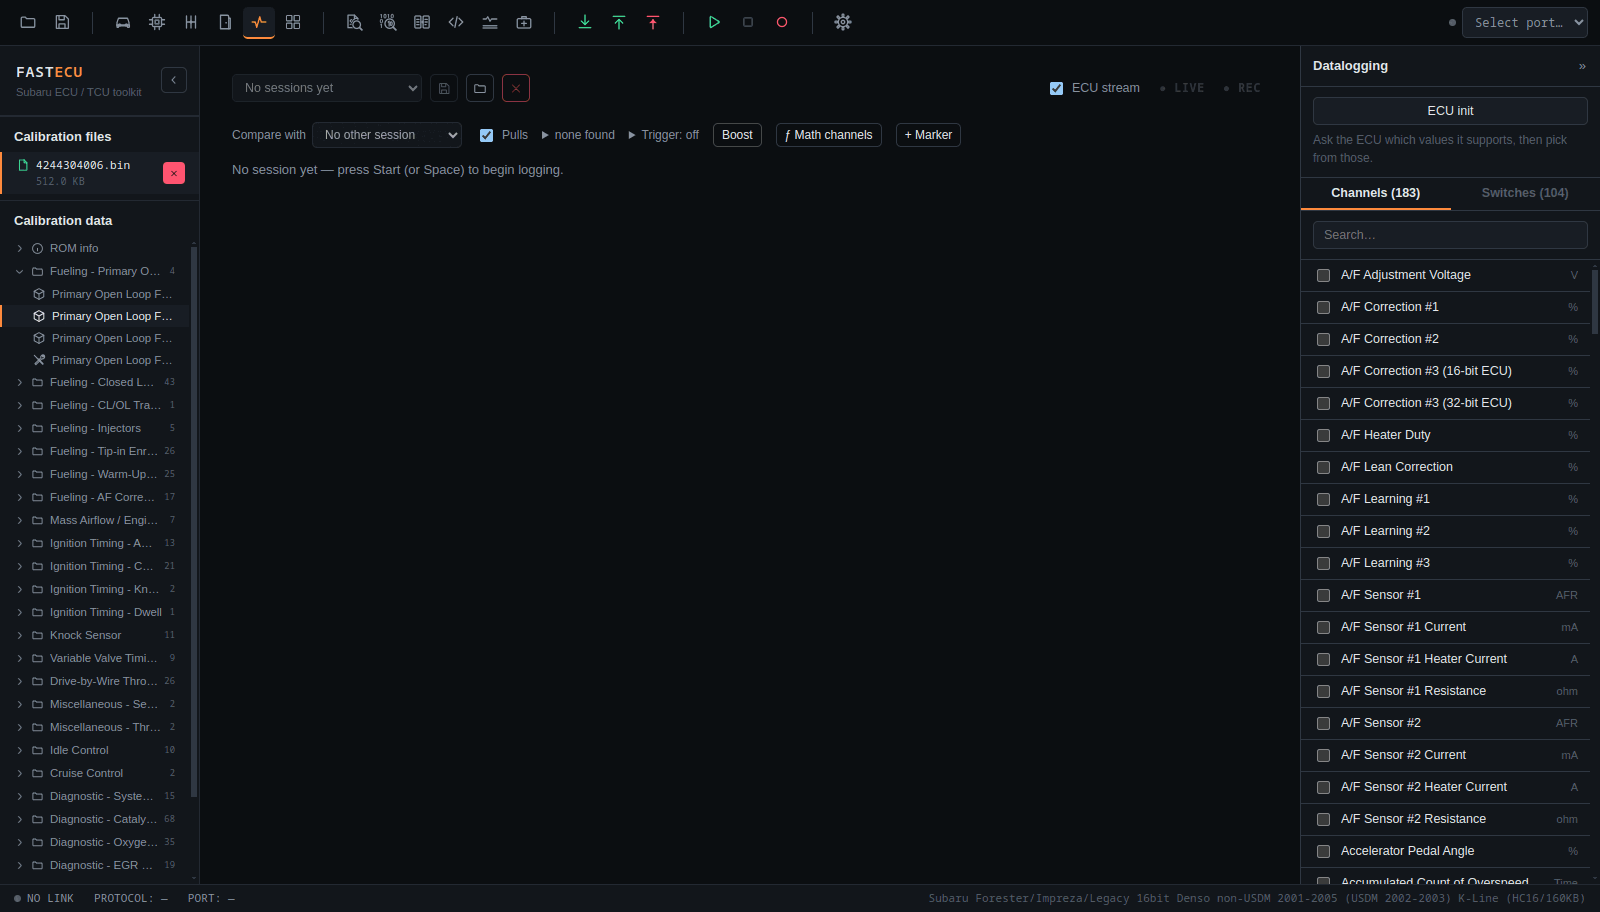
- Open the Datalogging panel on the right edge of the window. Press ECU init to ask the ECU which values it supports, then pick channels (and switches) from the Channels and Switches tabs. There is a search box.
- Press Start Logging in the toolbar (or Space). Stop Logging ends it. To save a CSV file in your log folder, arm Record (Ctrl+L).
The ECU and TCU pages' Live data tabs show the same session, so Start and Stop do the same thing everywhere.
Parameters come from a RomRaider logger.xml that you point to under Settings › Files › Logger definitions. After ECU init, FastECU offers only the parameters your ECU supports.
The ECU stream box (on by default, takes effect at the next Start) makes the ECU send values continuously instead of FastECU asking for each one. Turn it off to compare the two ways.
The plot
- One lane per channel on a shared timeline. Zoom with the mouse wheel, scroll, or use the navigator strip below. Live follows the newest data and Fit shows everything.
- A cursor follows the mouse and every lane shows its value at that moment.
Analysis tools
Math channels
The ƒ button lets you add channels computed from others, written with the channel name in brackets: [Engine Speed] * 2. You can use + - * / % ^, comparisons, && || ! and functions such as abs min max sqrt pow ln log exp round floor ceil clamp if(), plus d(x) for the change per second. Ready-made ones are offered for boost, lambda, injector duty, acceleration, mph, engine speed rise and full throttle. Formulas are never run as program code.
Pulls
Stretches with the throttle at or above a limit while engine speed climbs are outlined. The throttle limit, the shortest pull and the smallest rpm rise can be set, and each pull has a button that zooms to it. A gear change ends a pull.
Boost
The Boost button compares target boost with actual boost per full-throttle pull: peak boost, how much it overshot, the engine speed where it came within tolerance of the target, the mean error, and the highest wastegate duty. It also gives the figures per engine speed band.
Markers
Press M (or double-click the plot) to pin a named note at that moment. Markers can be renamed and removed, and are saved with the session.
Triggered recording
With Record armed, a file can be written only while a formula holds, for example [Accelerator Pedal Angle] >= 80 or [Feedback Knock Correction] != 0. You set seconds of pre-roll and post-roll. Every time the formula becomes true a new datalog-<time>-trigger-N.csv is started, with a marker where it begins.
Compare with
Draw a second session dashed over the viewed one, aligned on the start of both or on their first pulls. Each lane also shows the other session's value at the cursor. This is the quickest way to see what a change did.
Using logs for tuning
A datalog can also drive the MAF scaling, Injectors and Dyno tabs of the ECU page, and can be traced on calibration tables. These are covered in the tuning documentation.
This is not ready yet. Check back later, or ask on the forum.