Virtual dyno
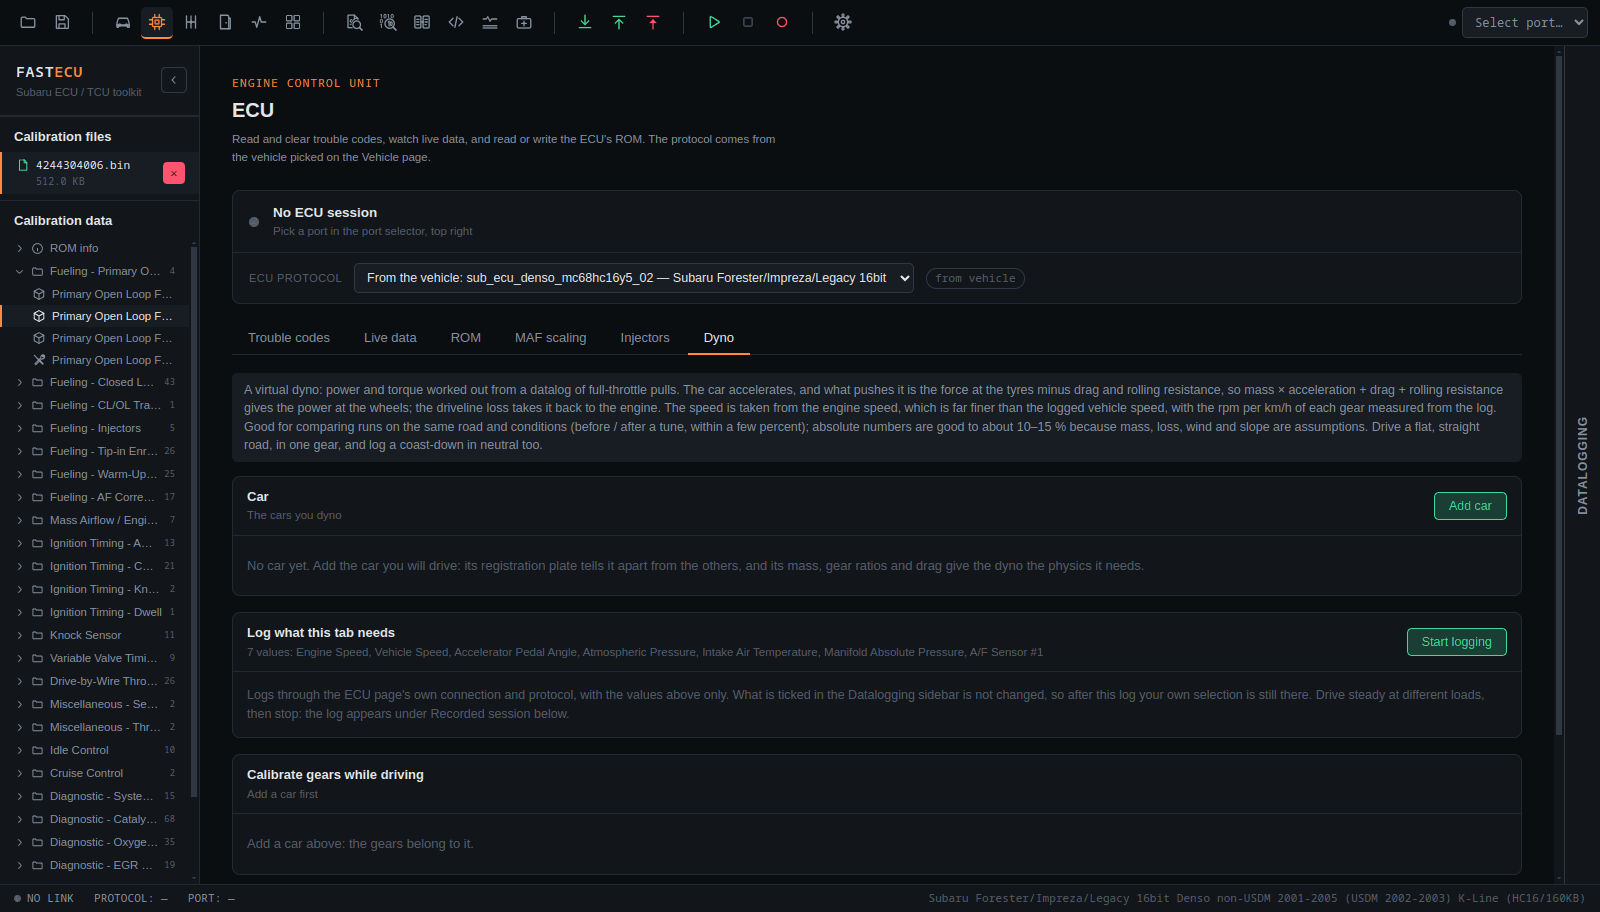
A virtual dyno: power and torque curves from a datalog of full-throttle pulls, the way an inertia dyno works.
Run against datalog files and checked against a synthetic car with a known torque curve. Not yet compared with a real dyno in real life. Before and after runs on the same road and conditions should agree within a few percent. Absolute numbers are only good to about 10-15 %, because the car's mass, driveline loss, wind and slope are assumptions. Manual cars only: a torque converter breaks the link between speed and engine speed.
How it calculates
The force at the tyres is the car's mass times acceleration, plus air drag and rolling resistance. Times speed that is wheel power; the driveline loss takes it to engine power, and engine power over engine speed gives torque. Speed comes from engine speed divided by the gear's rpm per km/h, measured from the log, because the logged vehicle speed is a whole km/h and too coarse. Air density comes from the logged atmospheric pressure and temperature, and an SAE J1349 / DIN 70020 correction brings the result to standard conditions.
1. Add your car
The tab keeps its own list of cars, apart from the vehicle on the Vehicle page. A car has a registration plate and a name, kerb weight and load, drag coefficient and frontal area, rolling resistance, driveline loss, tyre rolling circumference, final drive, engine and wheel inertia, its gears and notes. Reference runs are saved with the car.
For each gear you enter either the rpm per km/h directly, or the gearbox ratio and let it be worked out from the ratio, final drive and tyre.
2. Calibrate the gears while driving
- With logging running, the rpm per km/h of the gear you are in is shown live. When it reads steady, press Set gear N (or Add as gear N) to store it.
- Fit tyre to gear N works the tyre circumference out of a gear whose ratio and the final drive you know.
- After a drive the log can be searched for gears too, and a pull whose measured rpm per km/h differs from the car's gets an Update gear N button.
3. Log and find the pulls
Log what this tab needs logs engine speed, vehicle speed, throttle or pedal, atmospheric pressure, intake air temperature, manifold pressure and the front A/F sensor. Then pick the datalog. Pulls are found where the throttle is at or above a limit with the engine speed rising, in one gear, for a minimum time and rpm span. Each shows its gear, range, peaks and how its measured rpm per km/h compares with the car's, and you can leave pulls out.
4. Read the chart
- Engine power, wheel power and engine torque in kW, PS or hp, with each pull as a thin line.
- Saved reference runs drawn over the current one, which is how you compare before and after a tune.
- Manifold pressure and A/F by engine speed, when logged.
- Peak figures, the air conditions and the correction factor. Copy curve gives CSV text.
Coast-down
A stretch in neutral with the throttle closed gives the car's own rolling resistance and drag: deceleration = Crr × g + ρ × CdA × v² / 2m, fitted over the coast. A coast covering less than 35 km/h fits the drag only. Use for this car stores the result.
Do pulls only on a safe, flat, straight, legal road or a closed track, in a single gear. Never log or watch the screen while driving: have a passenger run the laptop.